Operation of the server www.hladiny.cz
The server www.hladiny.cz ("water_level") was set up to make data obtained by limnographic and precipitation measuring stations available to the general public, flood commissions or owners of endangered properties and to increase awareness of the current state of selected watercourses or the amount of precipitation at the installation of precipitation stations.

Server www.hladiny.cz
Water and rain gauge stations based on M4016, STELA or H1 units use data hosting on our server to store measured values of level, instantaneous flow, water temperature or amount of precipitation.
The www.hladiny.cz server combines data from the vast majority of installed water and rain gauge stations into one visualization application. We thank the owners and operators of these stations for allowing us to display the last measured values in this, we think useful, application.
Two basic overviews
The server separates data obtained from stations owned by CHMI and river basin companies from data from local warning systems (LVS) of cities and municipalities. The user is free to switch between the two reports.
The division has led to increased clarity and also separates qualitatively significant limnographic stations of state organizations installed on important water meter profiles of categories A and B from LVS stations, mostly only with local significance, installed on smaller streams and on water meter profiles of category C.
Sorting and searching for individual stations in reports
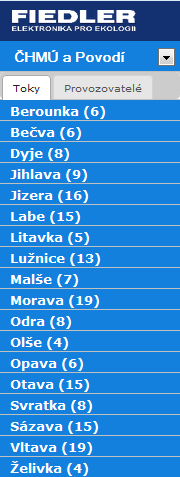
CHMI stations and river basin companies are classified either according to the main rivers to whose river basins the water meter profile belongs, or they can be switched to station classification according to station operators, ie individual CHMI branches or individual river basin companies.
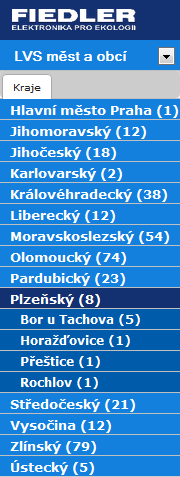
LVS stations are divided according to the founders, ie the names of cities and municipalities that operate the local warning system. For greater clarity, the individual warning systems are also assigned to 13 regions and the capital city of Prague.
Displaying stations on the map
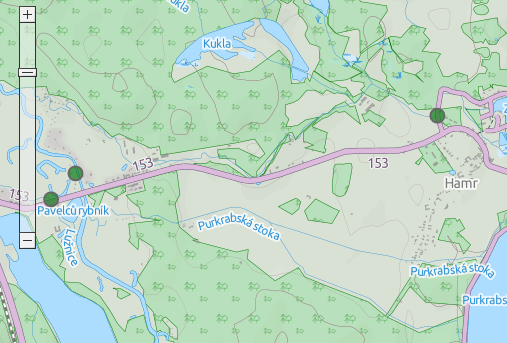
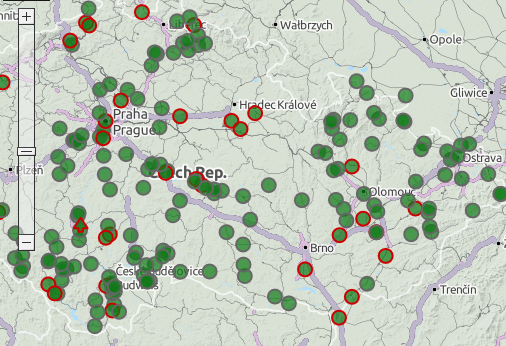
Water meter stations are shown on the map by a wheel, the color of which may change from bright green (I. flood stage) to red (3rd flood stage) if one of the flood levels is reached.

In addition, the server evaluates the rate of increase of the measured level, and when the set gradient is exceeded, a prominent up arrow appears instead of a circle on the map. The opposite arrow points to the station on the server map that has detected a rapid drop in level.
Rain gauges have their own mark on the server map in the shape of a blue drop. The user can switch between the joint display of water and rain gauge stations or between the display of only stations of one type.
Zooming
Map data are available on the server in 16 levels of zoom from the display of the whole world and Europe to the detailed display of the given locality in the scale of approximately 1: 2000. The user can jump between views using the mouse wheel or the + and - buttons in the upper left corner of the map.
Small two-day charts
For each limnographic and precipitation measuring station, a small two-day graph can be displayed by clicking on the station icon on the map or on the station nameplate in the left list of stations.

A small two-day chart of a limnographic station
Large weekly charts
Click on the small graph icon or press the Graphs button on the top command bar of the application to switch to the graphical display of large weekly graphs.

Weekly graph of limnigraphic station

Weekly graph of precipitation station
Support for mobile phones, iPods and tablets
The visualization application running on the server www.hladiny.cz is written in such a way that it can also be launched from portable mobile devices equipped with only a touch screen.
Display of clouds and precipitation activity
The basic map base can be supplemented with a semi-permeable layer carrying information about current clouds and precipitation activity. You can turn this layer on or off on the drop-down drop-down list at the top right of the screen.

Map with display of the current precipitation situation switched on


Download
Application
no related solutions